This analysis was used to determine, in terms of quantity, what inputs have a major influence on the outputs. Thus, it was possible to verify that only a limited number of independent variables act on each single experimental objective, even if, overall, each component is important for at least one controlled variable. Once this phase was completed, the method continued with the second order polynomial regression on each objective in order to obtain a plant meta-model that is susceptible to optimization and analytical analyses. The polynomial models obtained in this way, whether starting from the data supplied by the fractional design or the small design, were then statistically validated.
This technique, which was successfully implemented, is based on one hand on a variance analysis to verify the significance of the regression and, on the other, on a statistical test relative to the determination of the adaptation capacity of the meta- model to the analyzed situation.
Almost all polynomial meta-models demonstrated that they could pass both tests, despite the small number of tests and that, in any case, at least one polynomial (between the one obtained from the fractional and the one supplied by the SCD) was satisfactory on each objective (table I presents some results of the statistical tests).
A comparison between the polynomials showed a common response in the central area of the experimentation ranges and an obvious deviation at the edges where the quantity of available information differed greatly in one case compared to another.
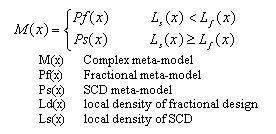
Therefore, a complex meta-model was produced as a composition of the two polynomials; obviously, this was possible only for the controlled variables in which both the polynomial models were able to pass the significance and adaptation tests.
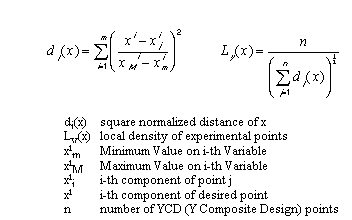
This new complex meta-model is defined as follows: the local density of experimental points is calculated, using a algorithm, for the small design and the fractionary design; the meta-model takes the value of the polynomial of the first or the second design depending on which of the two densities is higher.

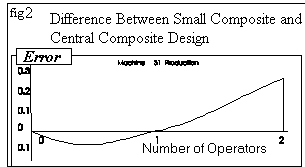
The discontinuity in the transition zones is negligible, for the specific case, with respect to the estimated error since, in the areas with uniform density, the behavior is similar (fig 2).


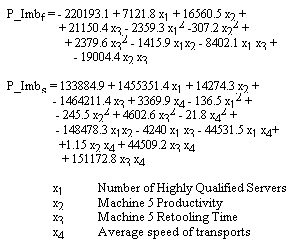
For the sake of brevity, only one of the complex meta-models produced is presented - that relative to the general packaging productivity divided into two simple meta-models obtained from the fractional (P_Imbf) and from the SCD (P_Imbs).

The significance band of the complex meta-model is defined while considering the regression error and the pure experimental error along with the deviation between the two polynomials; two surface responses obtained from complex meta-models are presented in figures 3 and 4.

Figure 3 illustrates that machine 30 may be negatively affected by an increase in the performance of machine 5 and by an increased number of skilled personnel.
This is due to the fact that personnel are taken off this machine to speed up the operations on number 20, which are more complex and which is the current site of the bottleneck; therefore, it is possible to identify the optimum number of skilled technicians.

Instead, Figure 4 clearly shows that packaging productivity improves considerably with an increase in the characteristics of machine 5 and in the number of skilled technicians.