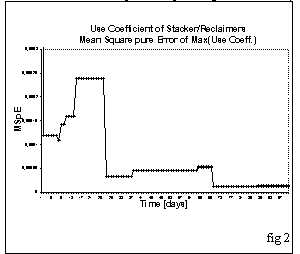
For example, some variables have a step-oriented development of the MSpE. These graphs correspond to the variables which express the maximum or minimum of a measured parameter (e.g. maximum waiting time at anchors of a ship that was then berthed). Figure 2 illustrates this type of variable.

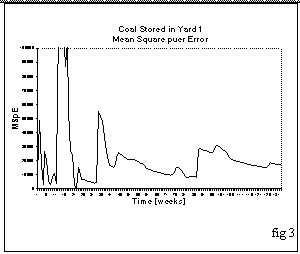
Instead, figure 3 represents a variable for which the Mean Square pure Error does not converge. In effect, this involves the instantaneous occupation of the various yards. This time development of the experimental error corresponds to the chaotic behaviour of these variables.

In fact, in other parallel studies that focused on this problem, it was found that the occupation of storage yards has a chaotic behaviour and the chaotic threshold can be identified in relation to the ratio of the capacity of the yard/total flow of goods.
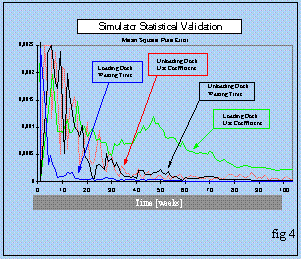
This parallel study did however indicate that it is impossible to modify the design to avoid the unpredictability regarding the yard situation since the threshold identified is outside the economic operating conditions. Finally, there are other variables which have the characteristic "asymptotic" development of the Mean Square pure Error like those reported in fig.4.

At the end of this analysis phase, it was found that the design cannot be modified to overcome some of the theoretical problems regarding operating management:
Ocean-going Ships which set sail because the time at anchors is too long.
Small coasting ships which remain at anchors for an extended time period to streamline the unloading operation of ocean-going vessels.
In effect, it was found that during the optimum simulation time (obtained from the analysis of the MSpE), there are always ships that are in these conditions. Even in this case, the solution to overcome the problem (extending the dock) is neither economically nor technically feasible.
Once this phase was completed, an analysis was performed on the effects, based on the contrast method, to identify the most significant and important factors to focus the experiment on these variables. The analysis performed indicated that there are correlations, as predicted, among some independent variables:
Maintenance logic & plant operating degeneration
traffic coefficient & breakdown of flows
As already mentioned, the different plant solutions were compared, dividing the experimental campaign into 4 different designs. By comparing the performances obtained, the operating characteristics of the terminal were extrapolated under the different conditions, while relying on an economic investment analysis to determine the most economical solution.
Based on the analysis performed, it was possible to identify the critical nature of three belts in terms of susceptible market variations, indicating therefore that they should be overdimensioned with respect to standard requirements.
On the other hand, with this configuration the plant was able to absorb large market oscillations, thus guaranteeing flexibility and efficiency.
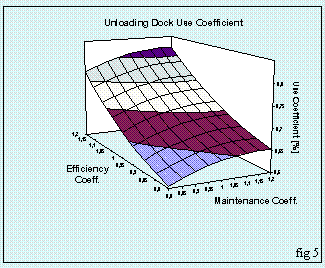
A 20% operating degeneration of the plant components turned out to be the optimum value in terms of performances (unloading time for ocean-going vessels) of the interval between scheduled maintenance operations.
Based on the analysis of the meta-models obtained, it was possible to identify the correct correlation interval between the maintenance operations and operating efficiency.

Therefore, it is possible to identify the optimum operating condition, based on optimisation of the ocean-going ship unloading time and the use of plant components. This procedure was used to identify an optimum scheduled maintenance frequency for each level of operating efficiency.
This means that during operating management operations it is possible to define the scheduled maintenance procedures based on the data relative to the average interval measured between two faults to maximise terminal efficiency. Obviously, this operating condition also depends on the type of traffic (classification of flows between transhipments, yard placement and direct service to the nearby power station).
Overall, acceptable management conditions can be obtained even with a high level of operating degeneration and with particularly fast flows (high direct transhipment).


